• chevron_right

      Rising seas will cut off many properties before they’re flooded

      news.movim.eu / ArsTechnica · Friday, 24 March, 2023 - 22:51 · 1 minute

    Image of a road with a low lying section under water.

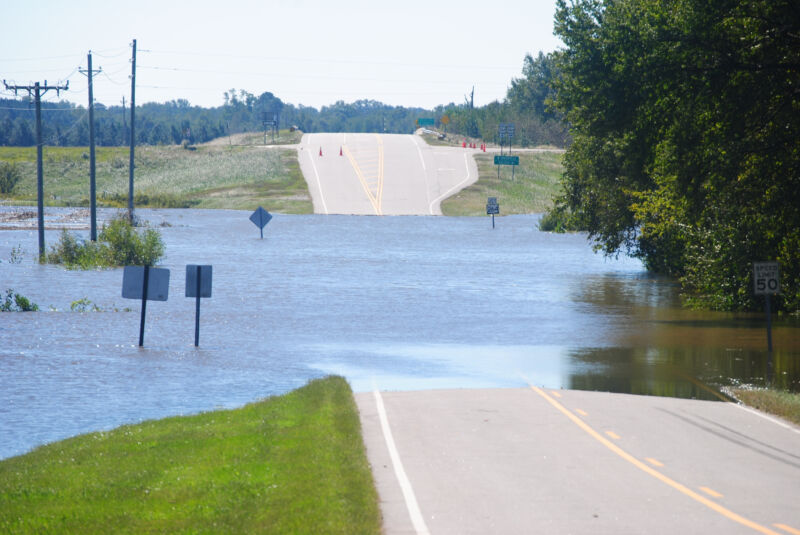
    Enlarge / If this road is your only route to the outside world, it might not matter that your house didn't flood. (credit: Maurice Alcorn / EyeEm )

    Climate change produces lots of risks that are difficult to predict. While it will make some events—heatwaves, droughts, extreme storms, etc.—more probable, all of those events depend heavily on year-to-year variation in the weather. So, while the odds may go up, it's impossible to know when one of these events will strike a given location.

    In contrast, sea level rise seems far simpler. While there's still uncertainty about just how quickly ocean levels will rise, other aspects seem pretty predictable. Given a predicted rate of sea level rise, it's easy to tell when a site will start ending up underwater. And that sort of analysis has been done for various regions.

    But having a property above water won't be much good if flooding nearby means you can't get to a hospital or grocery store when you need to or lose access to electricity or other services. It's entirely possible for rising seas to leave a property high, dry, but uninhabitable as rising seas cut connections to essential services. A group of researchers has analyzed the risk of isolation driven by sea level rise, and shows it's a major contributor to the future risks the US faces.

    Read 10 remaining paragraphs | Comments

    • chevron_right

      Greenland is about to lose ice faster than any time since the last ice age

      Scott K. Johnson · news.movim.eu / ArsTechnica · Wednesday, 30 September, 2020 - 17:38 · 1 minute

    Satellite view of desolate landscape.

    Enlarge / Clouds obscure the waters off Greenland's southwest coast. (credit: NASA EO )

    While the GRACE satellites were active, their incredibly precise gravity measurements tracked a loss of about 280 billion tons of ice from Greenland each year. That's glacial land ice that raises sea level as it flows into the ocean—and it's vanishing at a remarkable clip. But just how remarkable is that clip? We don't have such excellent measurements going back too far into Greenland's history.

    A new study led by the University of Buffalo's Jason Briner takes this question on. We have lots of paleoclimate records of climate conditions in Greenland, the position of the ice on the landscape, and even changes in sediments carried into the sea by meltwater. None of that directly tells you how much ice was accumulating or disappearing. To put the pieces together and calculate that, you need to combine that data with a model.

    Digital ice

    The researchers used a high-resolution ice-sheet model simulating (roughly) the southwest quadrant of Greenland. There's a good reason for that: the ice sheet mostly melts before reaching the ocean here, making it the simplest area to simulate. Since we've been tracking things, the year-to-year growth or losses of the ice sheet here nicely mirror the Greenland-wide total. So simulate this area well, and at high resolution, and your numbers should scale to the whole ice sheet.

    Read 9 remaining paragraphs | Comments

    index?i=3VPEQ88C3Yc:QNI-YS49tKc:V_sGLiPBpWUindex?i=3VPEQ88C3Yc:QNI-YS49tKc:F7zBnMyn0Loindex?d=qj6IDK7rITsindex?d=yIl2AUoC8zA
    • chevron_right

      New map shows vulnerability of Antarctic ice to self-fracking

      Scott K. Johnson · news.movim.eu / ArsTechnica · Wednesday, 26 August, 2020 - 19:31 · 1 minute

    In 2002, the Larsen B ice shelf disintegrated in a matter of weeks.

    Enlarge / In 2002, the Larsen B ice shelf disintegrated in a matter of weeks. (credit: NASA EO )

    In 2016, a study found that adding a couple new processes to a model of the Antarctic ice sheets made them much more vulnerable to melt, greatly increasing global sea level rise—both this century and in the centuries to come. It was an alarming result, to be sure, but also a bit conjectural. The researchers didn’t have a way to assess how realistically the new processes were modeled, so they viewed their paper as raising a question deserving attention, rather than providing an answer.

    The new processes were the collapse of ice cliffs above a certain height (a theoretical constraint, but not something we’ve watched happen) and hydrofracturing. The latter is a propagation of a surface fracture in the ice clean through to the bottom of the ice sheet as the crack fills with water. Hydrofracturing is a known commodity—it was probably the dominant process in the sudden collapse of Antarctica’s Larsen B ice shelf in 2002. The question here, instead, is how vulnerable is the rest of Antarctica to this process?

    A new study led by Ching-Yao Lai at Columbia University’s Lamont-Doherty Earth Observatory has tried to answer that question by mapping fractures and calculating where hydrofracturing should be possible.

    Read 10 remaining paragraphs | Comments

    index?i=lVY49woKll8:a4JTdYdQTJo:V_sGLiPBpWUindex?i=lVY49woKll8:a4JTdYdQTJo:F7zBnMyn0Loindex?d=qj6IDK7rITsindex?d=yIl2AUoC8zA
    • chevron_right

      Nagging sea level rise mismatch solved

      Scott K. Johnson · news.movim.eu / ArsTechnica · Wednesday, 19 August, 2020 - 20:30 · 1 minute

    Photograph of bathers dwarfed by enormous beach.

    Enlarge (credit: Chesapeake Bay Program )

    Sea level rise is an unambiguous consequence of climate change. Warmer water expands, while melted land ice flows into the sea. But what fun would it be if the natural world didn’t make things a little more complicated? A number of processes can cause the trends experienced on different coasts to vary, from ocean circulation to rising or falling land elevation. Although we've wanted to quantify each contributor to sea level rise, it should be no surprise that the numbers don’t always add up perfectly.

    So researchers have turned to a process called “closing the budget”—working on adding estimates of ice mass loss, thermal expansion of seawater, and change of water storage on land, and then comparing that to estimated sea level trends from tide gauges and satellites. Research has closed the budget for recent decades, including the era of good satellite data starting around 1990, and extending that back to about 1960. But in the first half of the 20th century, tide gauges are sparser, as are observations of glaciers and ocean temperatures. As a result, a mismatch has remained between what we'd expect based on estimated sea level rise causes and what we think we saw, based on estimated sea level rise. There was apparently more sea level rise than we could explain in that time period.

    Try, try again

    Researchers have been working on these problems from every angle, cleaning up dataset problems and tackling complications like land-elevation changes. So a team led by Thomas Frederikse at Caltech’s Jet Propulsion Laboratory decided it was time to try again. Frederikse and his colleagues find that estimates are now consistent all the way back to 1900. And that includes a couple of time periods of higher or lower rates of sea level rise along the way.

    Read 12 remaining paragraphs | Comments

    index?i=14vVf0M4744:mw_oy5c-hk0:V_sGLiPBpWUindex?i=14vVf0M4744:mw_oy5c-hk0:F7zBnMyn0Loindex?d=qj6IDK7rITsindex?d=yIl2AUoC8zA