• chevron_right

      Erlang Solutions: Elixir, 7 steps to start your journey

      news.movim.eu / PlanetJabber · Thursday, 19 September - 08:58 · 4 minutes

    Welcome to the series “Elixir, 7 Steps to Start Your Journey”, dedicated to those who want to learn more about this programming language and its advantages.

    If you still don’t have much experience in the world of programming, Elixir can be a great option to get started in functional programming , and if you have already experimented with other programming languages, not only will it be easier for you, but I am sure that you will find the differences between programming paradigms interesting.

    In any case, this series aims to help you have fun exploring Elixir and find enough reasons to choose it for your next project. I hope you enjoy it!

    Why a series dedicated to Elixir?

    Before fully entering the topic, I’ll share a little about my experience with Elixir and why I decided to write this series.

    I discovered Elixir in 2018, I would say, by chance. Someone told me about this programming language and how wonderful it was. At that time, I had no idea, nor had I had any contact with functional programming beyond university internships. However, a few months later, ElixirConf took place in Mexico, so I attended to learn more about this technology.

    The first thing that captivated me was how friendly the community was. Everyone was relaxed, having a lot of fun and sharing. The atmosphere was incredible. So, I joined this world and started collaborating on my first project with Elixir.

    The start of the journey

    At first, I didn’t have a good time since the project level was not that simple.

    The project used Phoenix Channels , and until then, I had not been involved in a project with real-time communication features. But to my surprise, it didn’t take me that long to understand how everything fits together; the code patterns were intuitive, there was a lot of documentation available, the syntax was lovely, and there were no files with hundreds of thousands of lines of code that made them difficult to understand.

    Many years have passed since that beginning, and I continue to enjoy programming with Elixir and being surprised by all the new things emerging in this community. So, I decided to write a series of posts to share these experiences that I hope will be helpful to those who are just getting to know this programming language. Spoiler: you won’t regret it.

    That being said, let’s talk about Elixir.

    Let’s talk about Elixir!

    Elixir is a dynamic, functional language for building scalable and maintainable applications.”

    José Valim created it in 2012, and version 1.0 was released in 2014. As you can see, it is a relatively young programming language supported by an excellent foundation, the BEAM .

    Elixir runs on the Erlang virtual machine known as BEAM. Some features of this machine are:

    • Simultaneously, it supports millions of users and transactions.
    • It has a mechanism to detect failures and recover from them.
    • It allows you to develop systems capable of operating without interruptions forever!
    • Allows real-time system updates without stopping or interrupting user activity.

    All these properties are transmitted to Elixir; plus, as I mentioned before, the syntax is quite intuitive and pleasant, and many resources are available, so creating a project from scratch to start experimenting will be a piece of cake.

    Elixir

    It’s been a short introduction, so for now, it’s okay if you’re not sure what role BEAM plays in this series. In the next chapter, we will delve into it.

    We only have to consider when we talk about Elixir;  it is also essential to know the fundamentals that make this programming language such a solid and reliable option. And if you don’t have much experience with functional programming, don’t worry; Elixir will help you understand the concepts while putting them into practice.

    What topics will the series cover?

    This series will cover the essential topics to help you develop a project from scratch and understand what is behind Elixir’s magic.

    The chapters will be divided as follows:

    1. Erlang Virtual Machine, the BEAM
    2. Understanding Processes and Concurrency
    3. Libraries and Frameworks
    4. Testing and Debugging
    5. The Elixir Community
    6. Functional Programming vs. Object-Oriented Programming
    7. My first project with Elixir!

    Is this series for me?

    This series is for you if you:

    • Are starting in the web programming world and don’t know which language to choose as your first option.
    • Already have programming experience, but want to explore new options and learn more about functional programming.

    Or if you are simply looking for a programming language that allows you to learn and have fun at the same time.

    Next chapter

    In the next post, “Erlang Virtual Machine, the BEAM”, we will talk about Erlang, the elements that make the BEAM so powerful, and how Elixir benefits from it. Don’t miss it! In the meantime, drop the team a message if you have any pressing Elixir questions.

    The post Elixir, 7 steps to start your journey appeared first on Erlang Solutions .

    • chevron_right

      Erlang Solutions: Top 5 Tips to Ensure IoT Security for Your Business

      news.movim.eu / PlanetJabber · Thursday, 13 June - 11:01 · 9 minutes

    In an increasingly tech-driven world, the implementation of IoT for business is a given. According to the latest data, there are currently 17.08 billion connected IoT devices – and counting. A growing number of devices requires robust IoT security to maintain privacy, protect sensitive data and prevent unauthorised access to connected devices.

    A single compromised device can be a threat to an entire network. For businesses, it can lead to major financial losses, operational disruptions and a major impact on brand reputation. We will be taking you through the five key considerations to ensure IoT for businesses including data encryption methods, password management, IoT audits, workplace education and the importance of disabling unused features.

    Secure password practices

    Weak passwords make IoT devices susceptible to unauthorised access, leading to data breaches, privacy violations and increased security risks. When companies install devices, without changing default passwords or by creating oversimplified ones, they create a gateway entry point for attackers. Implementing strong and unique passwords can ensure the protection of these potential threats.

    Password managers

    Each device in a business should have its own unique password that should change on a regular basis. According to the 2024 IT Trends Report by JumpCloud, 83% of organisations surveyed use password-based authentication for some IT resources.

    Consider using a business-wide password manager to store your passwords securely and that allows you to use unique passwords across multiple accounts.

    Password managers are also incredibly important as they:

    • Help to spot fake websites, protecting you from phishing scams and attacks.
    • Allow you to synchronise passwords across multiple devices, making it easy and safe to log in wherever you are.
    • Track if you are re-using the same password across different accounts for additional security.
    • Spot any password changes that could appear to be a breach of security.

    Multi-factor authentication (MFA)

    Multi-factor authentication (MFA) adds an additional layer of security. It requires additional verification beyond just a password, such as SMS codes, biometric data or other forms of app-based authentication. You’ll find that many password managers actually offer built-in MFA features for enhanced security.

    Some additional security benefits include:

    • Regulatory compliance
    • Safeguarding without password fatigue
    • Easily adaptable to a changing work environment
    • An extra layer of security compared to two-factor authentication (2FA)

    As soon as an IoT device becomes connected to a new network, it is strongly recommended that you reset any settings with a secure, complex password. Using password managers allows you to generate unique passwords for each device to secure your IoT endpoints optimally.

    Data encryption at every stage

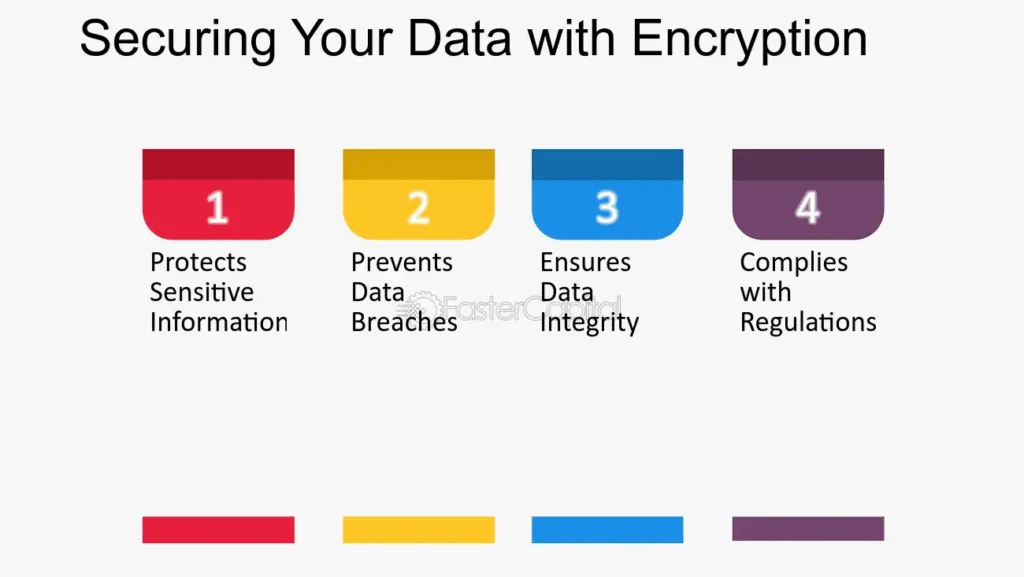
    Why is data encryption so necessary? With the increased growth of connected devices, data protection is a growing concern. In IoT, sensitive information (personal data, financial, location etc) is vulnerable to cyber-attacks if transmitted over public networks. When done correctly, data encryption renders personal data unreadable to those who don’t have outside access. Once that data is encrypted, it becomes safeguarded, mitigating unnecessary risks.

    IoT security data encryption

    Additional benefits to data encryption

    How to encrypt data in IoT devices

    There are a few data encryption techniques available to secure IoT devices from threats. Here are some of the most popular techniques:

    Triple Data Encryption Standard (Triple DES): Uses three rounds of encryption to secure data, offering a high-level of security used for mission-critical applications.

    Advanced Encryption Standard (AES) : A commonly used encryption standard, known for its high security and performance. This is used by the US federal government to protect classified information.

    Rivest-Shamir-Adleman (RSA): This is based on public and private keys, used for secure data transfer and digital signatures.

    Each encryption technique has its strengths, but it is crucial to choose what best suits the specific requirements of your business.

    Encryption support with Erlang/Elixir

    When implementing data encryption protocols for IoT security, Erlang and Elixir offer great support to ensure secure communication between IoT devices. We go into greater detail about IoT security with Erlang and Elixir in a previous article, but here is a reminder of the capabilities that make them ideal for IoT applications:

    1. Concurrent and fault-tolerant nature: Erlang and Elixir have the ability to handle multiple concurrent connections and processes at the same time. This ensures that encryption operations do not bottleneck the system, allowing businesses to maintain high-performing, reliable systems through varying workloads.
    2. Built-in libraries: Both languages come with powerful libraries, providing effective tools for implementing encryption standards, such as AES and RSA.
    3. Scalable: Both systems are inherently scalable, allowing for secure data handling across multiple IoT devices.
    4. Easy integration: The syntax of Elixir makes it easier to integrate encryption protocols within IoT systems. This reduces development time and increases overall efficiency for businesses.

    Erlang and Elixir can be powerful tools for businesses, enhancing the security of IoT devices and delivering high-performance systems that ensure robust encryption support for peace of mind.

    Regular IoT inventory audits

    Performing regular security audits of your systems can be critical in protecting against vulnerabilities. Keeping up with the pace of IoT innovation often means some IoT security considerations get pushed to the side. But identifying weaknesses in existing systems allows organisations to implement much- needed strategy.

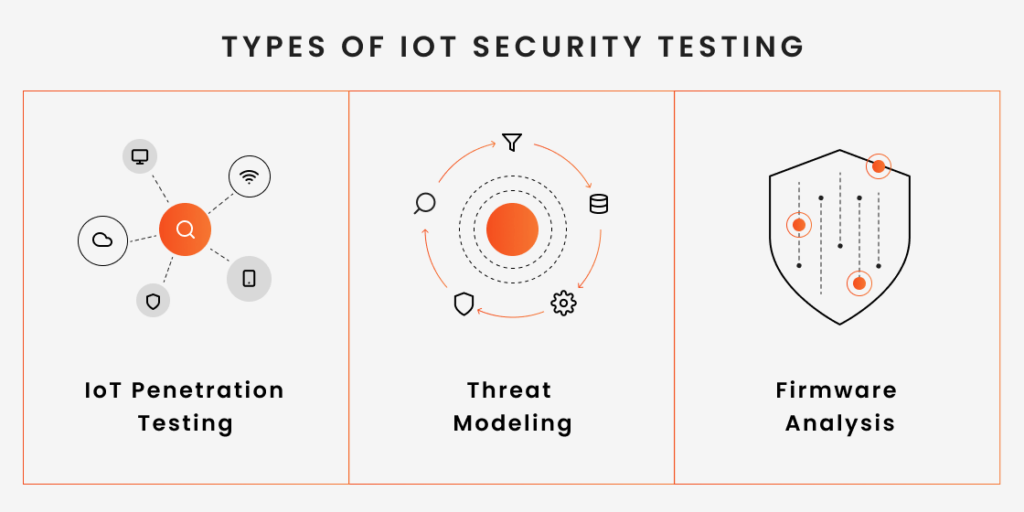
    Types of IoT security testing

    We’ve explained how IoT audits are key in maintaining secure systems. Now let’s take a look at some of the common types of IoT security testing options available:

    IoT security testing

    IoT security testing types

    Firmware software analysis

    Firmware analysis is a key part of IoT security testing. It explores the firmware, the core software embedded into the IoT hardware of IoT products (routers, monitors etc). Examining the firmware means security tests can identify any system vulnerabilities, that might not be initially apparent. This improves the overall security of business IoT devices.

    Threat modelling

    In this popular testing method, security professionals create a checklist based on potential attack methods, and then suggest ways to mitigate them. This ensures the security of systems by offering analysis of necessary security controls.

    IoT penetration testing

    This type of security testing finds and exploits security vulnerabilities in IoT devices. IoT penetration testing is used to check the security of real-world IoT devices, including the entire ecosystem, not just the device itself.

    Incorporating these testing methods is essential to help identify and mitigate system vulnerabilities. Being proactive and addressing these potential security threats can help businesses maintain secure IoT infrastructure, enhancing operational efficiency and data protection.

    Training and educating your workforce

    Employees can be an entry point for network threats in the workplace.

    The time of BYOD (bring your own devices) where an employee’s work supplies would consist of their laptops, tablets and smartphones in the office to assist with their tasks, is long gone. Now, personal IoT devices are also used in the workplace. Think of your popular wearables like smartwatches, fitness trackers, e-readers and portable game consoles. Even portable appliances like smart printers and smart coffee makers are increasingly popular in office spaces.

    Example of increasing IoT devices in the office. Source: House of IT

    The use of various IoT devices throughout your business network is the most vulnerable target for cybercrime, using techniques such as phishing and credential hacking or malware.

    Phishing attempts are among the most common. Even the most ‘tech-savvy’ person can fall victim to them. Attackers are skilled at making phishing emails seem legitimate, forging real domains and email addresses to appear like a legitimate business.

    Malware is another popular technique concealed in email attachments, sometimes disguised as Microsoft documents, unassuming to the recipient.

    Remote working and IoT security

    Threat or malicious actors are increasingly targeting remote workers. Research by Global Newswire shows that remote working increases the frequency of cyber attacks by a staggering 238%.

    The nature of remote employees housing sensitive data on various IoT devices makes the need for training even more important. There is now a rise in companies moving to secure personal IoT devices that are used for home working, with the same high security as they would corporate devices.

    How are they doing this? IoT management solutions. They provide visibility and control over other IoT devices. Key players across the IoT landscape are creating increasingly sophisticated IoT management solutions, helping companies administer and manage relevant updates remotely.

    The use of IoT devices is inevitable if your enterprise has a remote workforce.

    Regular remote updates for IoT devices are essential to ensure the software is up-to-date and patched. But even with these precautions, you should be aware of IoT device security risks and take steps to mitigate them.

    Importance of IoT training

    Getting employees involved in the security process encourages awareness and vigilance for protecting sensitive network data and devices.

    Comprehensive and regularly updated education and training are vital to prepare end-users for various security threats. Remember that a business network is only as secure as its least informed or untrained employee.

    Here are some key points employees need to know to maintain IoT security :

    • The best practices for security hygiene (for both personal and work devices and accounts).
    • Common and significant cybersecurity risks to your business.
    • The correct protocols to follow if they suspect they have fallen victim to an attack.
    • How to identify phishing, social engineering, domain spoofing, and other types of attacks.

    Investing the time and effort to ensure your employees are well informed and prepared for potential threats can significantly enhance your business’s overall IoT security standing.

    Disable unused features to ensure IoT security

    Enterprise IoT devices come with a range of functionalities. Take a smartwatch, for example. Its main purpose as a watch is of course to tell the time, but it might also include Bluetooth, Near-Field Communication (NFC), and voice activation. If you aren’t using these features, then you’re opening yourself up for hackers to potentially breach your device. Deactivation of unused features reduces the risk of cyberattacks, as it limits the ways for hackers to breach these devices.

    Benefits of disabling unused features

    If these additional features are not being used, they can create unnecessary security vulnerabilities. Disabling unused features helps to ensure IoT security for businesses in several ways:

    1. Reduces attack surface : Unused features provide extra entry points for attackers. Disabling features limits the number of potential vulnerabilities that could be exploited, in turn reducing attacks overall.
    2. Minimises risk of exploits : Many IoT devices come with default settings that enable features which might not be necessary for business operations. Disabling these features minimises the risk of weak security.
    3. Improves performance and stability : Unused features can consume resources and affect the performance and stability of IoT devices. By disabling them, devices run more efficiently and are less likely to experience issues that could be exploited by attackers.
    4. Simplifies security management : Managing fewer active features simplifies security oversight. It becomes simpler to monitor and update any necessary features.
    5. Enhances regulatory compliance : Disabling unused features can help businesses meet regulatory requirements by ensuring that only the necessary and secure functionalities are active.

    To conclude

    The continued adoption of IoT is not stopping anytime soon. Neither are the possible risks. Implementing even some of the five tips we have highlighted can significantly mitigate the risks associated with the growing number of devices used for business operations.

    Ultimately, investing in your business’s IoT security is all about safeguarding the entire network, maintaining the continuity of day-to-day operations and preserving the reputation of your business. You can learn more about our current IoT offering by visiting our IoT page or contacting our team directly .

    The post Top 5 Tips to Ensure IoT Security for Your Business appeared first on Erlang Solutions .

    • wifi_tethering open_in_new

      This post is public

      www.erlang-solutions.com /blog/top-5-tips-to-ensure-iot-security-for-your-business/

    • chevron_right

      Erlang Solutions: Guess Less with Erlang Doctor

      news.movim.eu / PlanetJabber · Thursday, 21 March, 2024 - 08:30 · 13 minutes

    BEAM languages, such as Erlang and Elixir, offer a powerful tracing mechanism, and Erlang Doctor is built on top of it. It stores function calls and messages in an ETS table, which lowers the impact on the traced system, and enables querying and analysis of the collected traces. Being simple, always available and easy to use, it encourages you to pragmatically investigate system logic rather than guess about the reason for its behaviour.
    This blog post is based on a talk I presented at the FOSDEM 2024 conference.

    Introduction

    It is tough to figure out why a piece of code is failing, or how unknown software is working. When confronted with an error or other unusual system behaviour, we might search for the reason in the code, but it is often unclear what to look for, and tools like grep can give a large number of results. This means that there is some guessing involved, and the less you know the code, the less chance you have of guessing correctly. BEAM languages such as Erlang and Elixir include a tracing mechanism, which is a building block for tools like dbg , recon or redbug . They let you set up tracing for specific functions, capture the calls, and print them to the console or to a file. The diagram below shows the steps of such a typical tracing activity, which could be called ad-hoc logging , because it is like enabling logging for particular functions without the need for adding log statements to the code.

    The first step is to choose the function (or other events) to trace, and it is the most difficult one, because usually, we don’t know where to start – for example, all we might know is that there is no response for a request. This means that the collected traces (usually in text format) often contain no relevant information, and the process needs to be repeated for a different function. A possible way of scaling this approach is to trace more functions at once, but this would result in two issues:

    1. Traces are like logs, which means that it is very easy to get overwhelmed with the amount of data. It is possible to perform a text search, but any further processing would require data parsing.
    2. The amount of data might become so large, that either structures like function arguments, return values and message contents become truncated, or the messages end up queuing up because of the I/O bottleneck.

    The exact limit of this approach depends on the individual case, but usually, a rule of thumb is that you can trace one typical module, and collect up to a few thousand traces. This is not enough for many applications, e.g. if the traced behaviour is a flaky test – especially if it fails rarely, or if the impact of trace collection makes it irreproducible.

    Tracing with Erlang Doctor

    Erlang Doctor is yet another tool built on top of the Erlang tracer, but it has an important advantage – by storing the traces in an ETS table, it reduces the impact on the traced system (by eliminating costly I/O operations), while opening up the possibility of further processing and analysis of the collected traces.

    Erlang Doctor is yet another tool built on top of the Erlang tracer, but it has an important advantage – by storing the traces in an ETS table, it reduces the impact on the traced system (by eliminating costly I/O operations), while opening up the possibility of further processing and analysis of the collected traces.

    Being no longer limited by the amount of produced text, it scales up to millions of collected traces, and the first limit you might hit is the system memory. Usually it is possible to trace all modules in an application (or even a few applications) at once, unless it is under heavy load. Thanks to the clear separation between data acquisition and analysis, this approach can be called ad-hoc instrumentation rather than logging. The whole process has to be repeated only in rare situations, e.g. if wrong application was traced. Of course tracing production nodes is always risky, and not recommended, unless very strict limits are set up in Erlang Doctor.

    Getting Started

    Erlang Doctor is available at https://github.com/chrzaszcz/erlang_doctor . For Elixir, there is https://github.com/chrzaszcz/ex_doctor , which is a minimal wrapper around Erlang Doctor. Both tools have Hex packages ( erlang_doctor , ex_doctor ). You have a few options for installation and running, depending on your use case:

    1. If you want it in your Erlang/Elixir shell right now, use the “firefighting snippets” provided in the Hex or GitHub docs. Because Erlang Doctor is just one module (and ExDoctor is two), you can simply download, compile, load and start the tool with a one-liner.
    2. For development, it is best to have it always at hand by initialising it in your ~/.erlang or ~/.iex.exs files. This way it will be available in all your interactive shells, e.g. rebar3 shell or iex -S mix .
    3. For easy access in your release, you can include it as a dependency of your project.

    Basic usage

    The following examples are in Erlang, and you can run them yourself – just clone erlang_doctor , compile it, and execute rebar3 as test shell . Detailed examples for both Erlang and Elixir are provided in the Hex Docs ( erlang_doctor , ex_doctor ). The first step is to start the tool:

    1> tr:start().
    {ok,<0.86.0>}
    

    There is also tr:start/1 with additional options . For example, tr:start(#{limit => 10000}) would stop tracing, when there are 10 000 traces in the ETS table, which provides a safety valve against memory consumption.

    Trace collection

    Having started the Erlang Doctor, we can now trace selected modules – here we are using a test suite from Erlang Doctor itself:

    2> tr:trace([tr_SUITE]).
    ok
    

    The tr:trace/1 function accepts a list of modules or {Module, Function, Arity} tuples. Alternatively, you can provide a map of options to trace specific processes or to enable message tracing. You can also trace entire applications, e.g. tr:trace_app(your_app) or tr:trace_apps([app1, app2]) .

    Let’s trace the following function call. It calculates the factorial recursively, and sleeps for 1 ms before each step:

    3> tr_SUITE:sleepy_factorial(3).
    6
    

    It’s a good practice to stop tracing as soon as you don’t need it anymore:

    4> tr:stop_tracing().
    ok
    

    Trace analysis

    The collected traces are accumulated in an ETS table (default name: trace ). They are stored as tr records, and to display them, we need to load the record definitions:

    5> rr(tr).
    [node,tr]
    

    If you don’t have many traces, you can just list all of them:

    6> tr:select().
    [#tr{index = 1, pid = <0.175.0>, event = call, mfa = {tr_SUITE,sleepy_factorial,1},
         data = [3], ts = 1559134178217371, info = no_info},
     #tr{index = 2, pid = <0.175.0>, event = call, mfa = {tr_SUITE,sleepy_factorial,1},
         data = [2], ts = 1559134178219102, info = no_info},
     #tr{index = 3, pid = <0.175.0>, event = call, mfa = {tr_SUITE,sleepy_factorial,1},
         data = [1], ts = 1559134178221192, info = no_info},
     #tr{index = 4, pid = <0.175.0>, event = call, mfa = {tr_SUITE,sleepy_factorial,1},
         data = [0], ts = 1559134178223107, info = no_info},
     #tr{index = 5, pid = <0.175.0>, event = return, mfa = {tr_SUITE,sleepy_factorial,1},
         data = 1, ts = 1559134178225146, info = no_info},
     #tr{index = 6, pid = <0.175.0>, event = return, mfa = {tr_SUITE,sleepy_factorial,1},
         data = 1, ts = 1559134178225153, info = no_info},
     #tr{index = 7, pid = <0.175.0>, event = return, mfa = {tr_SUITE,sleepy_factorial,1},
         data = 2, ts = 1559134178225155, info = no_info},
     #tr{index = 8, pid = <0.175.0>, event = return, mfa = {tr_SUITE,sleepy_factorial,1},
         data = 6, ts = 1559134178225156, info = no_info}]


    The index field is auto-incremented, and data contains an argument list or a return value, while ts is a timestamp in microseconds. To select specific fields of matching records, use tr:select/1 , providing a selector function, which is passed to ets:fun2ms/1 .

    7> tr:select(fun(#tr{event = call, data = [N]}) -> N end).
    [3, 2, 1, 0]
    

    You can use tr:select/2 to further filter the results by searching for a specific term in data . In this simple example we search for the number 2 :

    8> tr:select(fun(T) -> T end, 2).
    [#tr{index = 2, pid = <0.395.0>, event = call, mfa = {tr_SUITE,sleepy_factorial,1},
         data = [2], ts = 1705475521744690, info = no_info},
     #tr{index = 7, pid = <0.395.0>, event = return, mfa = {tr_SUITE,sleepy_factorial,1},
         data = 2, ts = 1705475521750454, info = no_info}]
    

    This is powerful, as it searches all nested tuples, lists and maps, allowing you to search for arbitrary terms. For example, even if your code outputs something like “Unknown error”, you can pinpoint the originating function call. There is a similar function tr:filter/1 , which filters all traces with a predicate function (this time not limited by fun2ms ). In combination with tr:contains_data/2 , you can get the same result as above:

    9> Traces = tr:filter(fun(T) -> tr:contains_data(2, T) end).
    [#tr{index = 2, pid = <0.395.0>, event = call, mfa = {tr_SUITE,sleepy_factorial,1},
         data = [2], ts = 1705475521744690, info = no_info},
     #tr{index = 7, pid = <0.395.0>, event = return, mfa = {tr_SUITE,sleepy_factorial,1},
         data = 2, ts = 1705475521750454, info = no_info}]


    There is also tr:filter/2 , which can be used to search in a different table than the current one – or in a list. As an example, let’s get only function calls from Traces returned by the previous call:

    10> tr:filter(fun(#tr{event = call}) -> true end, Traces).
    [#tr{index = 2, pid = <0.395.0>, event = call, mfa = {tr_SUITE,sleepy_factorial,1},
         data = [2], ts = 1705475521744690, info = no_info}]

    To find the tracebacks (stack traces) for matching traces, use tr:tracebacks/1 :

    11> tr:tracebacks(fun(#tr{data = 1}) -> true end).
    [[#tr{index = 3, pid = <0.395.0>, event = call, mfa = {tr_SUITE,sleepy_factorial,1},
          data = [1], ts = 1705475521746470, info = no_info},
      #tr{index = 2, pid = <0.395.0>, event = call, mfa = {tr_SUITE,sleepy_factorial,1},
          data = [2], ts = 1705475521744690, info = no_info},
      #tr{index = 1, pid = <0.395.0>, event = call, mfa = {tr_SUITE,sleepy_factorial,1},
          data = [3], ts = 1705475521743239, info = no_info}]]

    Note, that by specifying data = 1 , we are only matching return traces, as call traces always have a list in data . Only one traceback is returned, starting with a call that returned 1. What follows is the stack trace for this call. There was a second matching traceback, but it wasn’t shown, because whenever two tracebacks overlap, the longer one is skipped. You can change this with tr:tracebacks/2 , providing #{output => all}) as the second argument. There are more options available, allowing you to specify the queried table/list, the output format, and the maximum amount of data returned. If you only need one traceback, you can call tr:traceback/1 or tr:traceback/2 . Additionally, it is possible to pass a tr record (or an index) directly to tr:traceback/1 .


    To get a list of traces between each matching call and the corresponding return, use tr:ranges/1 :

    12> tr:ranges(fun(#tr{data = [1]}) -> true end).
    [[#tr{index = 3, pid = <0.395.0>, event = call, mfa = {tr_SUITE,sleepy_factorial,1},
          data = [1], ts = 1705475521746470, info = no_info},
      #tr{index = 4, pid = <0.395.0>, event = call, mfa = {tr_SUITE,sleepy_factorial,1},
          data = [0], ts = 1705475521748499, info = no_info},
      #tr{index = 5, pid = <0.395.0>, event = return, mfa = {tr_SUITE,sleepy_factorial,1},
          data = 1, ts = 1705475521750451, info = no_info},
      #tr{index = 6, pid = <0.395.0>, event = return, mfa = {tr_SUITE,sleepy_factorial,1},
          data = 1, ts = 1705475521750453, info = no_info}]]

    There is also tr:ranges/2 with options , allowing to set the queried table/list, and to limit the depth of nested traces. In particular, you can use #{max_depth => 1} to get only the top-level call and the corresponding return. If you only need the first range, use tr:range/1 or tr:range/2 .

    Last but not least, you can get a particular trace record with tr:lookup/1 , and replay a particular function call with tr:do/1 :

    13> T = tr:lookup(1).
    #tr{index = 1, pid = <0.175.0>, event = call, mfa = {tr_SUITE,sleepy_factorial,1},
        data = [3], ts = 1559134178217371, info = no_info}
    14> tr:do(T).
    6
    

    This is useful e.g. for checking if a bug has been fixed without running the whole test suite, or to reproduce an issue while capturing further traces. This function can be called with an index as the argument: tr:do(1) .

    Quick profiling

    Although there are dedicated profiling tools for Erlang, such as fprof and eprof , you can use Erlang Doctor to get a hint about possible bottlenecks and redundancies in your system with function call statistics. One of the advantages is that you already have the traces collected from your system, so you don’t need to trace again. Furthermore, tracing only specific modules gives you much simpler output, that you can easily read and process in your Erlang shell.

    Call statistics

    To get statistics of function call times, you can use tr:call_stat/1 , providing a function that returns a key by which the traces will be aggregated. The simplest use case is to get the total number of calls and their time. To do this, we group all calls under one key, e.g. total :

    15> tr:call_stat(fun(_) -> total end).
    #{total => {4,7216,7216}}

    The tuple {4,7216,7216} means that there were four calls in total with an accumulated time of 7216 microseconds, and the “own” time was also 7216 μs – this is the case because we have aggregated all traced functions. To see different values, let’s group the stats by the function argument:

    16> tr:call_stat(fun(#tr{data = [N]}) -> N end).
    #{0 => {1,1952,1952}, 1 => {1,3983,2031}, 2 => {1,5764,1781}, 3 => {1,7216,1452}}

    Now it is apparent that although sleepy_factorial(3) took 7216 μs, only 1452 μs were spent in the function itself, and the remaining 5764 μs were spent in the nested calls. To filter out unwanted function calls, just add a guard:

    17> tr:call_stat(fun(#tr{data = [N]}) when N < 3 -> N end).
    #{0 => {1,1952,1952}, 1 => {1,3983,2031}, 2 => {1,5764,1781}}

    There are additional utilities: tr:sorted_call_stat/1 and tr:print_sorted_call_stat/2 , which gives you different output formats.

    Call tree statistics

    If your code is performing the same operations very often, it might be possible to optimise it. To detect such redundancies, you can use tr:top_call_trees/0 , which detects complete call trees that repeat several times, where corresponding function calls and returns have the same arguments and return values, respectively. As an example, let’s trace a call to a function which calculates the 4th element of the Fibonacci sequence recursively. The trace table should be empty, so let’s clean it up first:

    18> tr:clean().
    ok
    19> tr:trace([tr_SUITE]).
    ok
    20> tr_SUITE:fib(4).
    3
    21> tr:stop_tracing().
    ok
    

    Now it is possible to print the most time-consuming call trees that repeat at least twice:

    22> tr:top_call_trees().
    [{13, 2, #node{module = tr_SUITE,function = fib, args = [2],
                   children = [#node{module = tr_SUITE, function = fib, args = [1],
                                     children = [], result = {return,1}},
                               #node{module = tr_SUITE, function = fib, args = [0],
                                     children = [], result = {return,0}}],
                   result = {return,1}}},
     {5, 3, #node{module = tr_SUITE,function = fib, args = [1],
                  children = [], result = {return,1}}}]

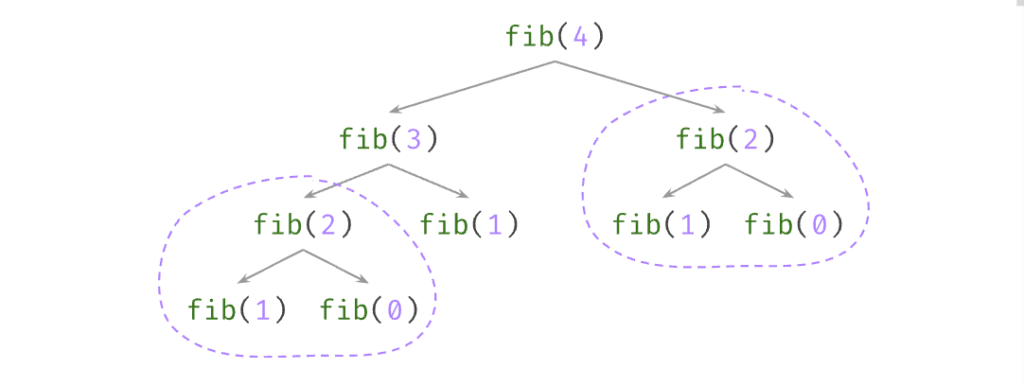
    The resulting list contains tuples {Time, Count, Tree} where Time is the accumulated time (in microseconds) spent in the Tree , and Count is the number of times the tree repeated. The list is sorted by Time , descending. In the example, fib(2) was called twice, which already shows that the recursive implementation is suboptimal. You can see the two repeating subtrees in the call tree diagram:
    The second listed tree consists only of fib(1) , and it was called three times. There is also tr:top_call_trees/1 with options , allowing customisation of the output format – you can set the minimum number of repetitions, maximum number of presented trees etc.

    ETS table manipulation

    To get the current table name, use tr:tab/0 :

    23> tr:tab().
    trace
    

    To switch to a new table, use tr:set_tab/1 . The table need not exist.

    24> tr:set_tab(tmp).
    ok
    

    Now you can collect traces to the new table without changing the original one. You can dump the current table to file with tr:dump/1 – let’s dump the tmp table:

    25> tr:dump("tmp.ets").
    ok
    

    In a new Erlang session, you can load the data with tr:load/1 . This will set the current table name to tmp . Finally, you can remove all traces from the ETS table with tr:clean/0 . To stop Erlang Doctor, just call tr:stop/0 .

    Summary

    Now you have an additional utility in your Erlang/Elixir toolbox, which you can try out whenever you need to debug an issue or learn about unknown or unexpected system behaviour. Just remember to be extremely cautious when using it in a production environment. If you have any feedback, please provide it on GitHub, and if you like the tool, consider giving it a star.

    The post Guess Less with Erlang Doctor appeared first on Erlang Solutions .

    • chevron_right

      Ignite Realtime Blog: Openfire inVerse plugin version 10.1.7.1 released!

      news.movim.eu / PlanetJabber · Friday, 15 March, 2024 - 12:55

    We have made available a new version of the inVerse plugin for Openfire! This plugin allows you to easily deploy the third-party Converse client in Openfire. In this release, the version of the client that is bundled in the plugin is updated to 10.1.7.

    The updated plugin should become available for download in your Openfire admin console in the course of the next few hours. Alternatively, you can download the plugin directly, from the plugin’s archive page .

    For other release announcements and news follow us on Mastodon or X

    1 post - 1 participant

    Read full topic

    • chevron_right

      Erlang Solutions: gen_statem Unveiled

      news.movim.eu / PlanetJabber · Thursday, 14 March, 2024 - 09:21 · 12 minutes

    gen_statem and protocols

    This blog post is a deep dive into some of the concepts discussed in my recent conference talk at FOSDEM . The presentation explored some basic theoretical concepts of Finite State Machines, and some special powers of Erlang’s gen_statem in the context of protocols and event-driven development, and building upon this insight, this post delves into harnessing the capabilities of the gen_statem behaviour. Let’s jump straight into it!

    Protocols

    The word protocol comes from the Greek “πρωτόκολλον”, from πρῶτος (prôtos, “first”) + κόλλα (kólla, “glue”), used in Byzantine greek as the first sheet of a papyrus-roll, bearing the official authentication and date of manufacture of the papyrus . Over time, the word describing the first page became a synecdoche for the entire document.

    The word protocol was then used primarily to refer to diplomatic or political treaties until the field of Information Technology overloaded the word to describe “treaties” too, but between machines, which as in diplomacy, governs the manner of communication between two entities . As the entities communicate, a given entity receives messages describing the interactions that peers are establishing with it, creating a model where an entity reacts to events .

    In this field of Technology, so much of the job of a programmer is implementing such communication protocol , which reacts to events . The protocol defines the valid messages and the valid order, and any side effects an event might have. You know many such protocols: TCP, TLS, HTTP, or XMPP, just to name some good old classics.

    The event queue

    As a BEAM programmer, implementing such an event-driven program is an archetypical paradigm you’re well familiar with: you have a process, which has a mailbox, and the process reacts to these messages one by one. It is the actor model in a nutshell: an actor can, in response to a message it receives:

    • send a finite number of messages to other Actors;
    • create a finite number of new Actors;
    • designate the behaviour to be used for the next message it receives.

    It is ubiquitous to implement such actors as a gen_server, but, pay attention to the last point: designate the behaviour to be used for the next message it receives . When a given event (a message) implies information about how the next event should be processed, there is implicitly a transformation of the process state. What you have is a State Machine in disguise.

    Finite State Machines

    Finite State Machines (FSM for short) are a function 𝛿 of an input state and an input event, to an output state where the function can be applied again. This is the idea of the actor receiving a message and designating the behaviour for the next: it chooses the state that will be input together with the next event.

    FSMs can also define output, in such cases they are called Finite State Transducers (FST for short, often simplified to FSMs too), and their definition adds another alphabet for output symbols, and the function 𝛿 that defines the machine does return the next state together with the next output symbol for the current input.

    gen_statem

    When the function’s input is the current state and an input symbol, and the output is a new state and a new output symbol, we have a Mealy machine . And when the output alphabet of one machine is the input alphabet of another, we can then intuitively compose them. This is the pattern that gen_statem implements.

    gen_statem has three important features that are easily overlooked, taking the best of pure Erlang programming and state machine modelling: it can simulate selective receives, offers an extended mailbox, and allows for complex data structures as the FSM state.

    Selective receives

    Imagine the archetypical example of an FSM, a light switch. The switch is for example digital and translates requests to a fancy light-set using an analogous cable protocol. The code you’ll need to implement will look something like the following:

    handle_call(on, _From, {off, Light}) ->
        on = request(on, Light),
        {reply, on, {on, Light}};
    handle_call(off, _From, {on, Light}) ->
        off = request(off, Light),
        {reply, off, {off, Light}};
    handle_call(on, _From, {on, Light}) ->
        {reply, on, {on, Light}};
    handle_call(off, _From, {off, Light}) ->
        {reply, off, {off, Light}}.

    But now imagine the light request was to be asynchronous, now your code would look like the following:

    handle_call(on, From, {off, undefined, Light}) ->
        Ref = request(on, Light),
        {noreply, {off, {on, Ref, From}, Light}};
    handle_call(off, From, {on, undefined, Light}) ->
        Ref = request(off, Light),
        {noreply, {on, {off, Ref, From}, Light}};
    
    handle_call(off, _From, {on, {off, _, _}, Light} = State) ->
        {reply, turning_off, State};  %% ???
    handle_call(on, _From, {off, {on, _, _}, Light} = State) ->
        {reply, turning_on, State}; %% ???
    handle_call(off, _From, {off, {on, _, _}, Light} = State) ->
        {reply, turning_on_wait, State};  %% ???
    handle_call(on, _From, {on, {off, _, _}, Light} = State) ->
        {reply, turning_off_wait, State}; %% ???
    
    handle_info(Ref, {State, {Request, Ref, From}, Light}) ->
        gen_server:reply(From, Request),
        {noreply, {Request, undefined, Light}}.

    The problem is, that now the order of events is not defined, and reorderings of the user requesting a switch and the light system announcing finalising the request are possible, so you need to handle these cases. When the switch and the light system had only two states each, you had to design and write four new cases: the number of new cases grows by multiplying the number of cases on each side. And each case is a computation of the previous cases, effectively creating a user-level callstack.

    So we now try migrating the code to a properly explicit state machine, as follows:

    off({call, From}, off, {undefined, Light}) ->
        {keep_state_and_data, [{reply, From, off}]};
    off({call, From}, on, {undefined, Light}) ->
        Ref = request(on, Light),
        {keep_state, {{Ref, From}, Light}, []};
    off({call, From}, _, _) ->
        {keep_state_and_data, [postpone]};
    off(info, {Ref, Response}, {{Ref, From}, Light}) ->
        {next_state, Response, {undefined, Light}, [{reply, From, Response}]}.
    
    on({call, From}, on, {undefined, Light}) ->
        {keep_state_and_data, [{reply, From, on}]};
    on({call, From}, off, {undefined, Light}) ->
        Ref = request(off, Light),
        {keep_state, {{Ref, From}, Light}, []};
    on({call, From}, _, _) ->
        {keep_state_and_data, [postpone]};
    on(info, {Ref, Response}, {{Ref, From}, Light}) ->
        {next_state, Response, {undefined, Light}, [{reply, From, Response}]}.

    Now the key lies in postponing requests: this is akin to Erlang’s selective receive clauses, where the mailbox is explored until a matching message is found. Events that arrive out of order can this way be treated when the order is right.

    This is an important difference between how we learn to program in pure Erlang, with the power of selective receives where we chose which message to handle, and how we learn to program in OTP, where generic behaviours like gen_server force us to handle the first message always, but in different clauses depending on the semantics of the message ( handle_cast, handle_call and handle_info ). With the power to postpone a message, we effectively choose which message to handle without being constrained with the code location.

    This section is inspired really by Ulf Wiger’s fantastic talk, Death by Accidental Complexity . So if you’ve known of the challenge he explained, this section hopefully serves as a solution to you.

    Complex Data Structures

    This was much explained in the previous blog on state machines , by using gen_statem’ s handle_event_function callback, apart from all the advantages explained in the aforementioned blog, we can also reduce the implementation of 𝛿 to a single function called handle_event , which makes the previous code take advantage of a lot of code reuse, see the following equivalent state machine:

    handle_event({call, From}, State, State, {undefined, Light}) ->
        {keep_state_and_data, [{reply, From, State}]};
    handle_event({call, From}, Request, State, {undefined, Light}) ->
        Ref = request(Request, Light),
        {keep_state, {{Ref, From}, Light}, []};
    handle_event({call, _}, _, _, _) ->
        {keep_state_and_data, [postpone]};
    handle_event(info, {Ref, Response}, State, {{Ref, From}, Light}) ->
        {next_state, Response, {undefined, Light}, [{reply, From, Response}]}.

    This section was extensively described in the previous blog post so to learn more about it, please enjoy your read!

    An extended mailbox

    We saw that the function 𝛿 of the FSM in question is called when a new event is triggered. In implementing a protocol, this is modelled by messages to the actor’s mailbox. In a pure FSM, a message that has no meaning within a state would crash the process, but in practice, while the order of messages is not defined, it might be a valid computation to postpone them and process them when we reach the right state.

    This is what a selective receive would do, by exploring the mailbox and looking for the right message to handle for the current state. In OTP, the general practice is to leave the lower-level communication abstractions to the underlying language features, and code in a higher and more sequential style as defined by the generic behaviours: in gen_statem , we have an extended view of the FSM’s event queue.

    There are two more things to notice we can do with gen_statem actions: one is to insert ad-hoc events with the construct {next_event, EventType, EventContent} , and the other is to insert timeouts, which can be restarted automatically on any new event, any state change, or not at all. These seem like different event queues for our eventful state machine, together with the process’s mailbox, but really it is only one queue we can see as an extended mailbox.

    The mental picture is as follows: There is only one event queue, which is an extension of the process mailbox, and this queue has got three pointers:

    • A head pointing at the oldest event;
    • A current pointing at the next event to be processed.
    • A tail pointing at the youngest event;

    This model is meant to be practically identical to how the process mailbox is perceived .

    • postpone causes the current position to move to its next younger event, so the previous current position is still in the queue reachable from head .
    • Not postponing an event i.e consuming it causes the event to be removed from the queue and current position to move to its next younger event.
    • NewState =/= State causes the current position to be set to head i.e the oldest event.
    • next_event inserts event(s) at the current position i.e as just older than the previous current position.
    • {timeout, 0, Msg} inserts a timeout, Msg event after tail i.e as the new youngest received event.

    Let’s see the event queue in pictures:


    handle_event(Type1, Content1, State1, Data) ->
    {keep_state_and_data, [postpone]};
    8oICre6HDbYA50WEcP3-s4U1tuBjBsW6QBAxBE-904WT2LLLCvSNOd0q9W88CrqM0AA6BUSWPSOc3TL1d-kNs8A8XLinFPUVJ9-fQkZ4NFzKlhsvZ7kO1P13H-gzssYP5q4TAGSF-2osVeJzgPYx6hw When the first event to process is 1 , after any necessary logic we might decide to postpone it. In such case, the event remains in the queue, reachable from HEAD , but Current is moved to the next event in the queue, event 2 .

    handle_event(Type1, Content1, State1, Data) ->
    {keep_state_and_data, [postpone]};
    ...
    handle_event(Type2, Content2, State1, Data) ->
    {next_state, State2};
    LBtgKzLRtZCXo5R6NBtPU_GI8_cIfj53ZnVKKrWmQC0hgk8avy9xGKavA6WEyy7uhC4KPks5bzUem_k6ZzN3i670VncbEK8a3Duhy-mwvgX9TYYv_NLjCdMs-I5sMdWegYT8ILSTK7qPZxuiMpB_EOo When handling event 2 , after any necessary logic, we decide to transition to a new state. In this case, 2 is removed from the queue, as it has been processed, and Current is moved to HEAD , which points again to 1 , as the state is now a new one.

    handle_event(Type1, Content1, State1, Data) ->
    {keep_state_and_data, [postpone]};
    ...
    handle_event(Type2, Content2, State1, Data) ->
    {next_state, State2};
    ...
    handle_event(Type1, Content1, State2, Data) ->
    {keep_state_and_data, [{next_event, TypeA, ContentA}]};
    XJGw9UZku0Mx90WHeck-QpmvRyYlxNM_Am-7FkqWZfvCuqIJX9lfhDIx1MLjGOau9U_sTCY_8OHZOBY0pWbNTFX-C5OC5rjklyFzdfqIjSU5G7MopYCb6sCIS11WlitZjBLBPj4eFrGnJ63IG-wUWyo After any necessary handling for 1 , we now decide to insert a next_event called A . Then 1 is dropped from the queue, and A is inserted at the point where Current was pointing. HEAD is also updated to the next event after 1 , which in this case is now A .
    handle_event(Type1, Content1, State1, Data) ->
    {keep_state_and_data, [postpone]};
    ...
    handle_event(Type2, Content2, State1, Data) ->
    {next_state, State2};
    ...
    handle_event(Type1, Content1, State2, Data) ->
    {keep_state_and_data, [{next_event, TypeA, ContentA}]};
    ...
    handle_event(TypeA, ContentA, State2, Data) ->
    {keep_state_and_data, [postpone]};

    vebJ5EXY48AZQvGsM2f5pB3BoLe8Meq7NknpqdeICiMhMHuzzpqX5saAMsyw2oBe5Akh0oUvHDQ-cSnp-YEtAuTCmNrwu8Gkx5iY1rPUctQ5d2cYXAyRJk7J-pKfzrugO5e0pkJ-2VQdxbPgZZ-PdlU Now we decide to postpone A , so Current is moved to the next event in the queue, 3 .

    handle_event(Type1, Content1, State1, Data) ->
    {keep_state_and_data, [postpone]};
    ...
    handle_event(Type2, Content2, State1, Data) ->
    {next_state, State2};
    ...
    handle_event(Type1, Content1, State2, Data) ->
    {keep_state_and_data, [{next_event, TypeA, ContentA}]};
    ...
    handle_event(TypeA, ContentA, State2, Data) ->
    {keep_state_and_data, [postpone]};
    ...
    handle_event(Type3, Content3, State2, Data) ->
    keep_state_and_data;
    Or2R4Obr12CTlQSK1chBu5nNneEA7yNjTzC_g2N4PqXfAJJPRq_rqwbor-jYwcuxbFHOH32fHAVAjXydFavQAOIwehPqXX2PljD_qLhgxN9W8IcStNsQS38k05IVp6IOe7FtVGdkLJKbraebbzRhSZA 3 is processed normally, and then dropped from the queue. No other event is inserted nor postponed, so Current is simply moved to the next, 4 .


    handle_event(Type1, Content1, State1, Data) ->
    {keep_state_and_data, [postpone]};
    ...
    handle_event(Type2, Content2, State1, Data) ->
    {next_state, State2};
    ...
    handle_event(Type1, Content1, State2, Data) ->
    {keep_state_and_data, [{next_event, TypeA, ContentA}]};
    ...
    handle_event(TypeA, ContentA, State2, Data) ->
    {keep_state_and_data, [postpone]};
    ...
    handle_event(Type3, Content3, State2, Data) ->
    keep_state_and_data;
    ...
    handle_event(Type4, Content4, State2, Data) ->
    {keep_state_and_data,
    [postpone, {next_event, TypeB, ContentB}]};
    Q2WfdHZUnxTZHo7WcSNT8x1z2SZkpwoFVyOgN-Fip5BzwV38pr3-RCYziIJC8vSyz8_btJP8Uv-Wifil6sOOiLY3SjKOhiZS0jS0nIsz--qOyOSSEraqUY0d0LuEXrwCB13989Z-EYd9DYyMJDAWdgU And 4 is now postponed, and a new event B is inserted, so while HEAD still remains pointing at A , 4 is kept in the queue and Current will now point to the newly inserted event B .

    This section is in turn inspired by this comment on GitHub.

    Conclusions

    We’ve seen how protocols are governances over the manners of communication between two entities and that these governances define how messages are transmitted, and processed, and how they relate to each other. We’ve seen how the third clause of the actor model dictates that an actor can designate the behaviour to be used for the next message it receives and how this essentially defines the 𝛿 function of a state machine and that Erlang’s gen_statem behaviour is an FSM engine with a lot of power over the event queue and the state data structures.

    Do you have protocol implementations that have suffered from extensibility problems? Have you had to handle an exploding number of cases to implement when the event order might reorder in any possible way? If you’ve suffered from death by accidental complexity, or your code has suffered from state machines in disguise, or your testing isn’t comprehensive enough by default, the tricks and points of view of this post should help you get started, and we can always help you keep moving forward!

    The post gen_statem Unveiled appeared first on Erlang Solutions .

    • chevron_right

      JMP: Newsletter: eSIM Adapter (and Google Play Fun)

      news.movim.eu / PlanetJabber · Tuesday, 12 March, 2024 - 20:31 · 4 minutes

    Hi everyone!

    Welcome to the latest edition of your pseudo-monthly JMP update!

    In case it’s been a while since you checked out JMP, here’s a refresher: JMP lets you send and receive text and picture messages (and calls) through a real phone number right from your computer, tablet, phone, or anything else that has a Jabber client.  Among other things, JMP has these features: Your phone number on every device; Multiple phone numbers, one app; Free as in Freedom; Share one number with multiple people.

    eSIM Adapter

    This month we’re pleased to announce the existence of the JMP eSIM Adapter. This is a device that acts exactly like a SIM card and will work in any device that accepts a SIM card (phone, tablet, hotspot, Rocket Stick), but the credentials it offers come from eSIMs provided by the user. With the adapter, you can use eSIMs from any provider in any device, regardless of whether the device or OS support eSIM. It also means you can move all your eSIMs between devices easily and conveniently. It’s the best of both worlds: the convenience of downloading eSIMs along with the flexibility of moving them between devices and using them on any device.

    So how are eSIMs downloaded and written to the device in order to use them? The easiest and most convenient way will be the official Android app, which will of course be freedomware and available in F-droid soon. The app is developed by PeterCxy of OpenEUICC fame. If you have an OS that bundles OpenEUICC, it will also work for writing eSIMs to the adapter. The app is not required to use the adapter, and swapping the adapter into another device will work fine. What if you want to switch eSIMs without putting the card back into an Android device? No problem; as long as your other device supports the standard SIM Toolkit menus, you will be able to switch eSIMs on the fly.

    What if you don’t have an Android device at all? No problem, there are a few other options for writing eSIMs to the adapter. You can get a PC/SC reader device (about $20 on Amazon for example) and then use a tool such as lpac to download and write eSIMs to the adapter from your PC. Some other cell modems may also be supported by lpac directly. Finally, there is work in progress on an optional tool that will be able to use a server (optionally self-hosted) to facilitate downloading eSIMs with just the SIM Toolkit menus.

    There is a very limited supply of these devices available for testing now, so if you’re interested, or just have questions, swing by the chatroom (below) and let us know. We expect full retail roll-out to happen in Q2.

    Cheogram Android

    Cheogram Android saw a major new release this month, 2.13.4-1 includes a visual refresh, many fixes, and some features including:

    • Allow locally muting channel participants
    • Allow setting subject on messages and threads
    • Display list of recent threads in channel details
    • Support full channel configuration form for owners
    • Register with channel when joining, deregister when leaving (where supported)
    • Expert setting to choose voice message codec

    Is My Contact List Uploaded?

    Cheogram Android has always included optional features for integrating with your local Android contacts (if you give permission). If you add a Jabber ID to an Android contact, their name and image are displayed in the app. Additionally, if you use a PSTN gateway (such as cheogram.com, which JMP acts as a plugin for) all your contacts with phone numbers are displayed in the app, making it easy to message or call them via the gateway. This is all done locally and no information is uploaded anywhere as part of this feature.

    Unfortunately, Google does not believe us. From speaking with developers of similar apps, it seems Google no longer believe anyone who has access to the device contacts is not uploading them somewhere. So, starting with this release, Cheogram Android from the Play Store says when asking for contact permission that contacts are uploaded. Not because they are, but because Google requires that we say so. The app’s privacy policy also says contacts are uploaded; again, only because Google requires that it say this without regard for whether it is true.

    Can any of your contacts be exposed to your server? Of course. If you choose to send a message or make a call, part of the message or call’s metadata will transit your server, so the server could become aware of that one contact. Similarly, if you view the contact’s details, the server may be asked whether it knows anything about this contact. And finally, if you tap the “Add Contact” button in the app to save this contact to your server-side list, that one contact is saved server-side. Unfortunately, spelling out all these different cases did not appease Google, who insisted we must say that we “upload the contact list to the server” in exactly those words. So, those words now appear.

    Thanks for Reading

    The team is growing! This month we welcome SavagePeanut to the team to help out with development.

    To learn what’s happening with JMP between newsletters, here are some ways you can find out:

    Thanks for reading and have a wonderful rest of your week!

    • wifi_tethering open_in_new

      This post is public

      blog.jmp.chat /b/march-newsletter-2024

    • chevron_right

      ProcessOne: Matrix gateway setup with ejabberd

      news.movim.eu / PlanetJabber · Monday, 11 March, 2024 - 09:48 · 4 minutes

    As of version 24.02 , ejabberd is shipped with a Matrix gateway and can participate in the Matrix
    federation
    . This means that an XMPP client can exchange messages with Matrix users or rooms.

    Let’s see how to configure your ejabberd to enable this gateway.

    Configuration in ejabberd

    HTTPS listener

    First, add an HTTP handler , as Matrix uses HTTPS for Server-Server API.

    In the listen section of your ejabberd.yml configuration file, add a handler on Matrix port 8448 for path /_matrix that calls the mod_matrix_gw module. You must enable TLS on this port to accept HTTPS connections (unless a proxy already handles HTTPS in front of ejabberd) and provide a valid certificate for your Matrix domain (see matrix_domain below). You can set this certificate using the certfile option of the listener, like in the example below, or listing it in the certfiles top level option .

    Example :

    listen:
      -
        port: 5222
        module: ejabberd_c2s
      -
        port: 8448 # Matrix federation
        module: ejabberd_http
        tls: true
        certfile: "/opt/ejabberd/conf/matrix.pem"
        request_handlers:
          "/_matrix": mod_matrix_gw
    

    If you want to use a non-standard port instead of 8448 , you must serve a /.well-known/matrix/server on your Matrix domain (see below).

    Server-to-Server

    You must enable s2s (Server-to-Server federation) by setting an access rule all or allow on s2s_access top level option:

    Example :

    s2s_access: s2s
    
    access_rules:
      local:
        - allow: local
      c2s:
        - deny: blocked
        - allow
      s2s:
        - allow # to allow Matrix federation
    

    Matrix gateway module

    Finally, add mod_matrix_gw module in the modules list.

    Example :

    modules:
      mod_matrix_gw:
        matrix_domain: "matrixdomain.com"
        key_name: "key1"
        key: "SU4mu/j8b8A1i1EdyxIcKlFlrp+eSRBIlZwGyHP7Mfo="
    

    matrix_domain

    Replace matrixdomain.com with your Matrix domain. That domain must resolve to your ejabberd server or serve a file https://matrixdomain.com/.well-known/matrix/server that contains a JSON file with the address and Matrix port (as defined by the Matrix HTTPS handler, see above) of your ejabberd server:

    Example :

    {
       "m.server": "ejabberddomain.com:8448"
    }
    

    key_name & key

    The key_name is arbitrary. The key value is your base64-encoded ed25519 Matrix signing key . It can be generated by Matrix tools or in an Erlang shell using the command base64:encode(element(2, crypto:generate_key(eddsa, ed25519))). :

    Example :

    $ erl
    Erlang/OTP 24 [erts-12.3.1] [source] [64-bit] [smp:8:8] [ds:8:8:10] [async-threads:1] [dtrace]
    
    Eshell V12.3.1 (abort with ^G)
    1> base64:encode(element(2, crypto:generate_key(eddsa, ed25519))).
    <<"SU4mu/j8b8A1i1EdyxIcKlFlrp+eSRBIlZwGyHP7Mfo=">>
    2> q().
    ok
    

    Once your configuration is ready, you can restart ejabberd.

    Testing

    To check if your setup is correct, go to the following page and enter your Matrix domain (as set by the matrix_domain option):
    https://federationtester.matrix.org/

    This page should list any problem related to Matrix on your ejabberd installation.

    Routing

    What messages are routed to an external Matrix server?

    Implicit routing

    Let’s say an XMPP client connected to your ejabberd server sends a message to a JID user1@domain1.com . If domain1.com is defined by the hosts parameter of your ejabberd server (i.e. it’s one of your XMPP domains), the message will be routed locally. If it’s not, ejabberd will try to establish an XMPP Server-to-Server connection to a remote domain1.com XMPP server. If this fails (i.e. there is no such external domain1.com XMPP domain), then ejabberd will try on the Matrix federation, transforming the user1@domain1.com JID into the Matrix ID @user1:domain1.com and will try to open a connection to a remote domain1.com Matrix domain.

    Explicit routing

    It is also possible to route messages explicitly to the Matrix federation by setting the option matrix_id_as_jid in the mod_matrix_gw module to true :

    Example :

    modules:
      mod_matrix_gw:
        host: "matrix.@HOST@"
        matrix_domain: "matrixdomain.com"
        key_name: "key1"
        key: "SU4mu/j8b8A1i1EdyxIcKlFlrp+eSRBIlZwGyHP7Mfo="
        matrix_id_as_jid: true
    

    In this case, the automatic fallback to Matrix when XMPP s2s fails is disabled and messages must be explicitly sent to the matrix gateway service Jabber ID to be routed to a remote Matrix server.

    To send a message to the Matrix user @user:remotedomain.com , the XMPP client must send a message to the JID user%remotedomain.com@matrix.xmppdomain.com , where matrix.xmppdomain.com is the JID of the gateway service as set by the host option of the mod_matrix_gw module (the keyword @HOST@ is replaced with the XMPP domain of the server). If host is not set, the Matrix gateway JID is your XMPP domain with the matrix. prefix added.

    The default value for matrix_id_as_jid is false , so the implicit routing will be used if this option is not set.

    The post Matrix gateway setup with ejabberd first appeared on ProcessOne .
    • wifi_tethering open_in_new

      This post is public

      www.process-one.net /blog/matrix-gateway-setup-with-ejabberd/

    • chevron_right

      Ignite Realtime Blog: Openfire 4.8.1 Release

      news.movim.eu / PlanetJabber · Monday, 4 March, 2024 - 15:57 · 1 minute

    The Ignite Realtime Community is pleased to announce the release of Openfire 4.8.1. This release addresses a number of issues found with the major 4.8.0 release a few months back.

    Interested in getting started? You can download installers of Openfire here . Our documentation contains an upgrade guide that helps you update from an older version.

    sha256sum checksum values for the release artefacts are as follows

    2ff28c5d7ff97305b2d6572e60b02f3708e86750d959459d7c5d6e17d4f9f932  openfire-4.8.1-1.noarch.rpm
    f622719e4dbd43aadc9434ba4ebc0d8c65ec30dd25a7d2e99c7de33006a24f56  openfire_4.8.1_all.deb
    3507b5d64c961daf526a52a73baaac7c84af12eb0115b961c2f95039255aec57  openfire_4_8_1.dmg
    141f6eaf374dfb7c4cca345e1b598fed5ce3af9c70062a8cc0d9571e15c29c7d  openfire_4_8_1.exe
    c6f0cf25a2d10acd6c02239ad59ab5954da5a4b541bc19949bd381fefb856da1  openfire_4_8_1.tar.gz
    bec5b03ed56146fec2f84593c7e7b269ee5c32b3a0d5f9e175bd41f28a853abe  openfire_4_8_1_x64.exe
    7403113b701aaf8a37dcd2d7e22fbb133161d322ad74505c95e54eaf6533f183  openfire_4_8_1.zip
    

    For other release announcements and news follow us on Mastodon or X

    1 post - 1 participant

    Read full topic

    • chevron_right

      Isode: Cobalt 1.5 – New Capabilities

      news.movim.eu / PlanetJabber · Thursday, 29 February, 2024 - 13:18 · 1 minute

    Overview

    This release adds new functionality and features to Cobalt, our web based role and user provisioning tool. You can find out more about Cobalt here .

    Multiple Cobalt Servers

    This enhancement enables multiple Cobalt servers to be run against a single directory. There are two reasons for this.

    1. In a distributed environment it is useful to have multiple Cobalt servers at different locations, each connected to the local node of a multi-master directory.
    2. Where a read only directory is replicated, for example using Sodium Sync to a Mobile Unit, it is useful to run Cobalt (read only) against the replica, to allow local administrators to conveniently view the configuration using Cobalt.

    Password Management and Password Policy

    This update includes a number of enhancements relating to password management:

    1. Cobalt is now aware of password policy. A key change is that after administrator creation or change of password, when password policy requires user change, Cobalt will mark the password as requiring user change. To be useful in deployment, the applications used also need to be password policy aware.
    2. Cobalt added a user UI to enable password change/reset, to complement Administrator password change.
    3. Administrator option to email new password to user.

    Security Management

    1. Directory Access Rights Management. M-Vault Directory Groups enable specification of user rights, to directory and messaging configuration in the directory. This can be configured by Cobalt by domain administrators.
    2. Certificate expiry checking. When managing a directory holding many certificates, it is important to keep them up to date. Cobalt provides a tool which can be run at intervals to determine certificates which have expired and certificates which will expire soon.

    User Directory Viewer

    Cobalt’s primary purpose is directory administration. This update adds a complementary tool which enables users to access information in the directory managed by Cobalt. This uses anonymous access for user convenience.

    Miscellaneous

    1. Flexible Search. Cobalt administrators have the option to configure search fields available for users. Configuration is per-domain.
    2. Users, Roles and mailing list members now sorted alphabetically.
    3. Base DN can be specified for users for a domain. If specified, Cobalt allows browsing users under this DIT (entry) using subtree search. Add user operation is disabled if this is specified. This allows Cobalt to:
      1. Utilize User provision by other means, for reference from within Cobalt managed components.
      2. To modify the entries, but does not allow addition of new entries.
    • wifi_tethering open_in_new

      This post is public

      www.isode.com /company/wordpress/cobalt-1-5-new-capabilities/